Validate your data with the Validation dashboard
Validate your data with the Validation dashboard
The Validation Dashboard provides details of each individual QP event as it’s collected and validated by Qubit’s data processing pipeline. For invalid events, you can view granular details relating to each error so that you can begin troubleshooting.
Getting started
Select Data tools and then Validation from the side menu.
Getting an overview of captured events
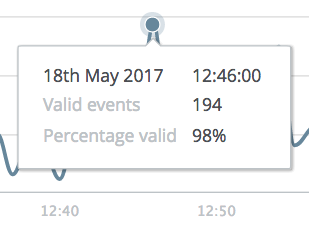
The Events captured panel shows a timeline for valid and invalid events over the last hour, day, week, or month.
Hovering over any of the data points shows the event counts and an overview of the current percentage of events that are valid or invalid. In the following example, we can see that for May 18 2017 there were 194 valid events and that 98% of those events were valid:
If you’re seeing a high number of invalid events for any event type, contact Coveo Support.
Invalid events for any event type won’t be processed by Qubit for use in the platform.
Getting an overview of errors
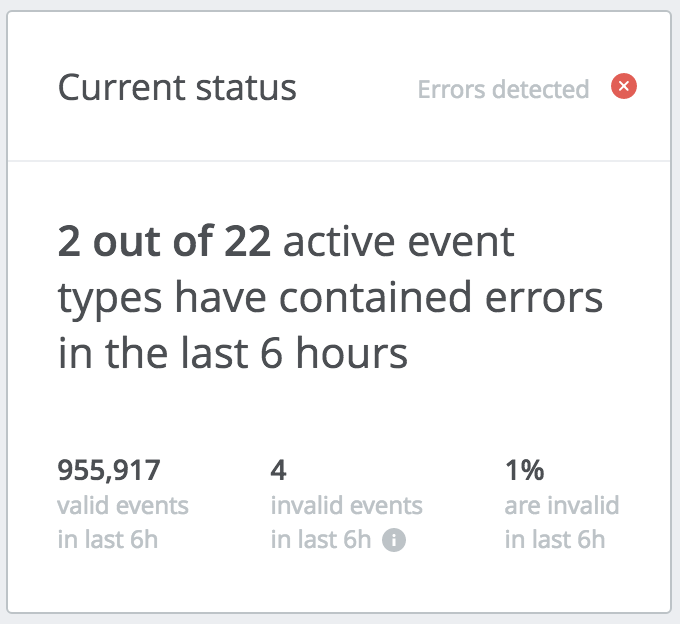
The Current status shows a snapshot of the status of current events for your property over the last 6 hours:
Metrics include:
-
Valid events: Events with a structure that conform to Qubit’s data dictionary. Once emitted and collected by Qubit’s servers, these are stored in our system for use in the Qubit platform.
-
Invalid events: Events with a structure that doesn’t conform to Qubit’s guidelines. Though collected, this data isn’t available for use in our platform.
-
Invalid events as a percentage of total events
-
Number of event types with errors: Number of event types with errors over the last 6 hours
Event types
This panel shows a separate panel for each of the implemented event types over the last 6 hours.
By default, panels are sorted by Lowest performance first but you can also sort alphabetically in Order A-Z, and by Most recent first:

Each panel displays the following information:
-
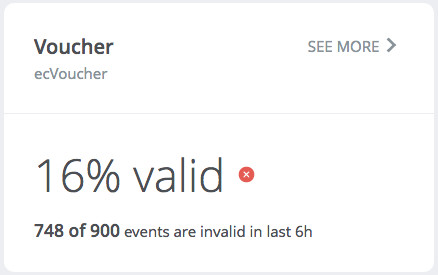
Event type name: The name of the event, which is currently taken from the technical name. The ability to define custom names will be added in a future release.
-
Event type technical name: The name used by our data processing systems as captured by our data layer, either directly from the site or through a mapper. The technical name is provided for developers.
-
The percentage of valid events: The percentage of valid events as a proportion of total events. A red warning icon will display if there’s at least a single invalid event, as shown in the following example:
-
A breakdown of invalid events versus total events: The total number of invalid events for the event type over the last 6 hours.
You can use the Events Inspector to view more information about each event type. To open it, select SEE MORE.
Inspecting events in detail
The Events Inspector shows more detailed information about the selected event. Along the top of the page, you’ll find details of:
-
The technical event name
-
The event description
-
Whether the event contains personal data
-
The percentage of valid events over the last 6 hours
-
The number of invalid events
In the following example, we can see the details for the ecBasketItem event.
The event doesn’t contain personal data and has 100% event validity:
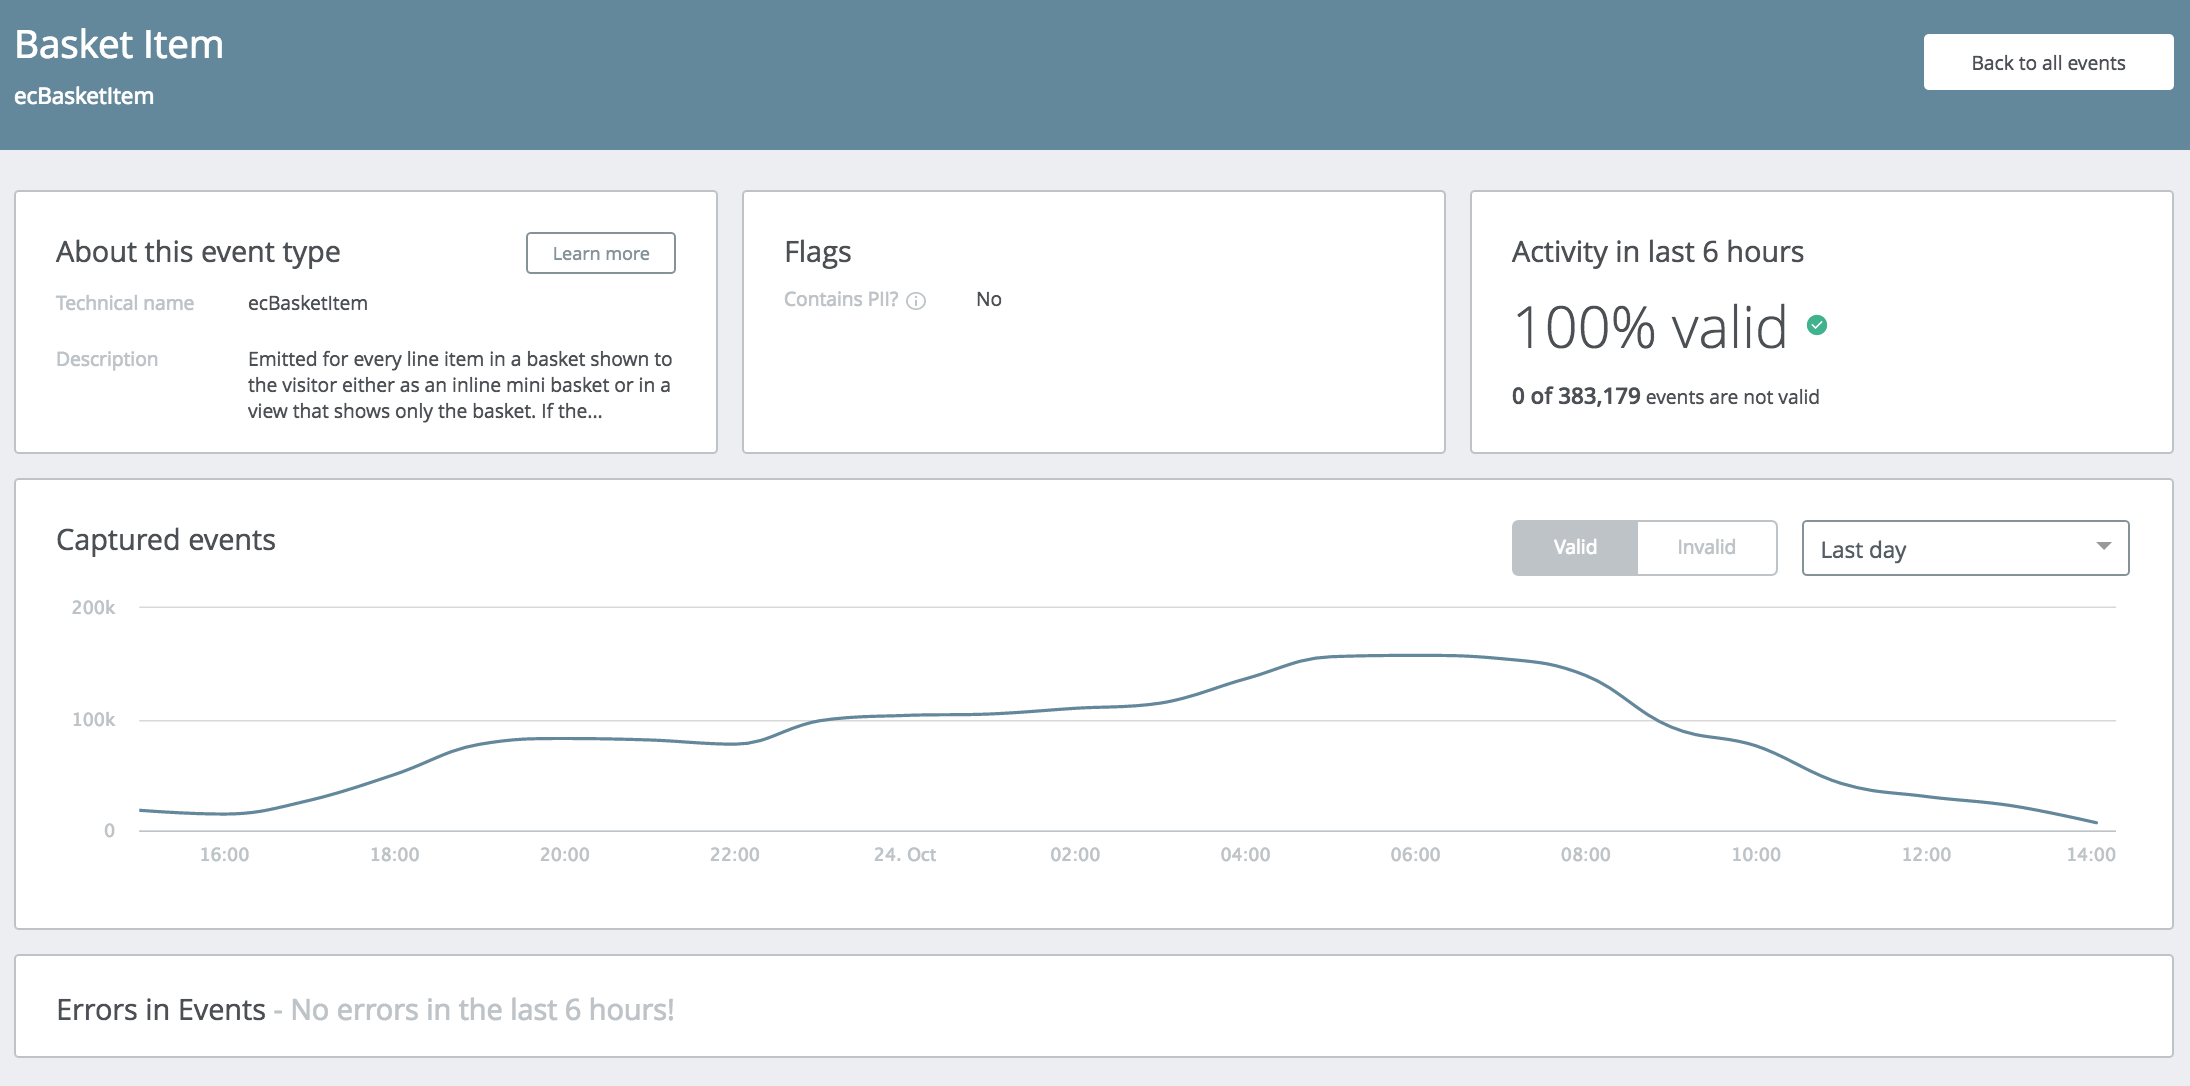
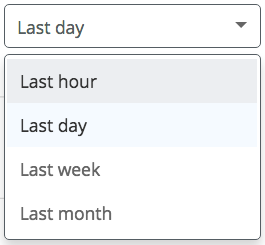
The Captured events panel shows the timeline for valid and invalid events for the selected event. The default reporting period is Last day but you can change this by making a selection from the combo box in the upper-right hand corner of the panel:
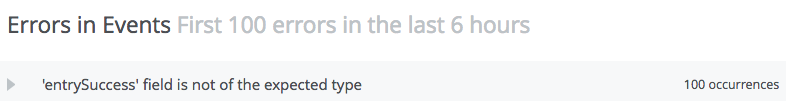
The Errors in Events panel provides an overview of all the errors associated with any invalid events over the last 6 hours. These are capped to the last hundred errors.
In the following example, the panel reports an error with the entrySuccess field:
Select ![]() you can view the error details:
you can view the error details:
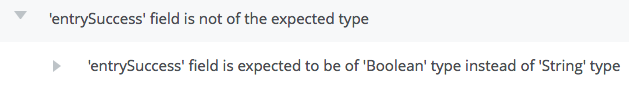
In the above example, the reported error is 'entrySuccess' field is expected to be of 'Boolean' type instead of 'String' type.
Selecting the arrow at the next level down will display the error at the event field level:
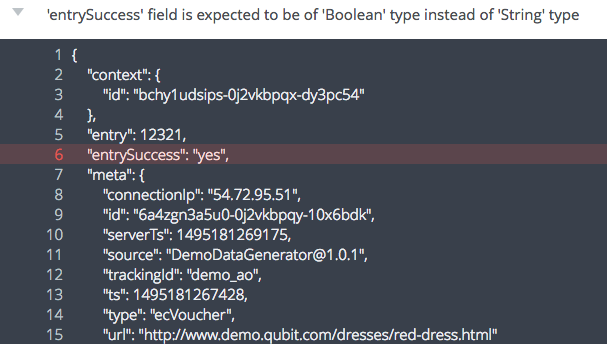
You can view an example event with the correct syntax by selecting  .
.
Select  to close this view.