---
title: Monitor system performance
slug: pbib2006
canonical_url: https://docs.coveo.com/en/pbib2006/
collection: manage-an-organization
source_format: adoc
---
# Monitor system performance
As you progress through your Coveo journey, monitoring system performance becomes crucial to ensure optimal search experiences for your users.
To help you achieve this, Coveo provides a dedicated [**System Performance**](https://platform.cloud.coveo.com/admin/#/orgid/organization/system-performance/) ([platform-ca](https://platform-ca.cloud.coveo.com/admin/#/orgid/organization/system-performance/) | [platform-eu](https://platform-eu.cloud.coveo.com/admin/#/orgid/organization/system-performance/) | [platform-au](https://platform-au.cloud.coveo.com/admin/#/orgid/organization/system-performance/)) page within the Administration Console.
This article offers a centralized view of key indexing and query performance metrics, enabling you to proactively manage and optimize your Coveo organization.
The **System Performance** page consists of two tabs: [**Content indexing**](#content-indexing-tab) and [**Queries**](#queries-tab).
This article provides an overview of each tab and offers optimization tips to help you enhance your organization's performance.
## Content indexing tab
The **Content indexing** tab provides insights into the performance of your content indexing processes.
It displays metrics such as the number of items indexed over time and any throttling events that may impact indexing speed.
By monitoring these metrics, you can ensure that your content is being indexed efficiently and take corrective actions if necessary.
Additionally, the counts are displayed next to your license limits, enabling efficient monitoring of your usage.
If you regularly approach or exceed your license limits, you can take proactive steps to manage your content indexing activities and avoid potential disruptions.
You can also contact your Coveo representative or [Coveo Support](https://connect.coveo.com/s/case/Case/Default) to discuss options for increasing your license limits to better accommodate your organization's needs.
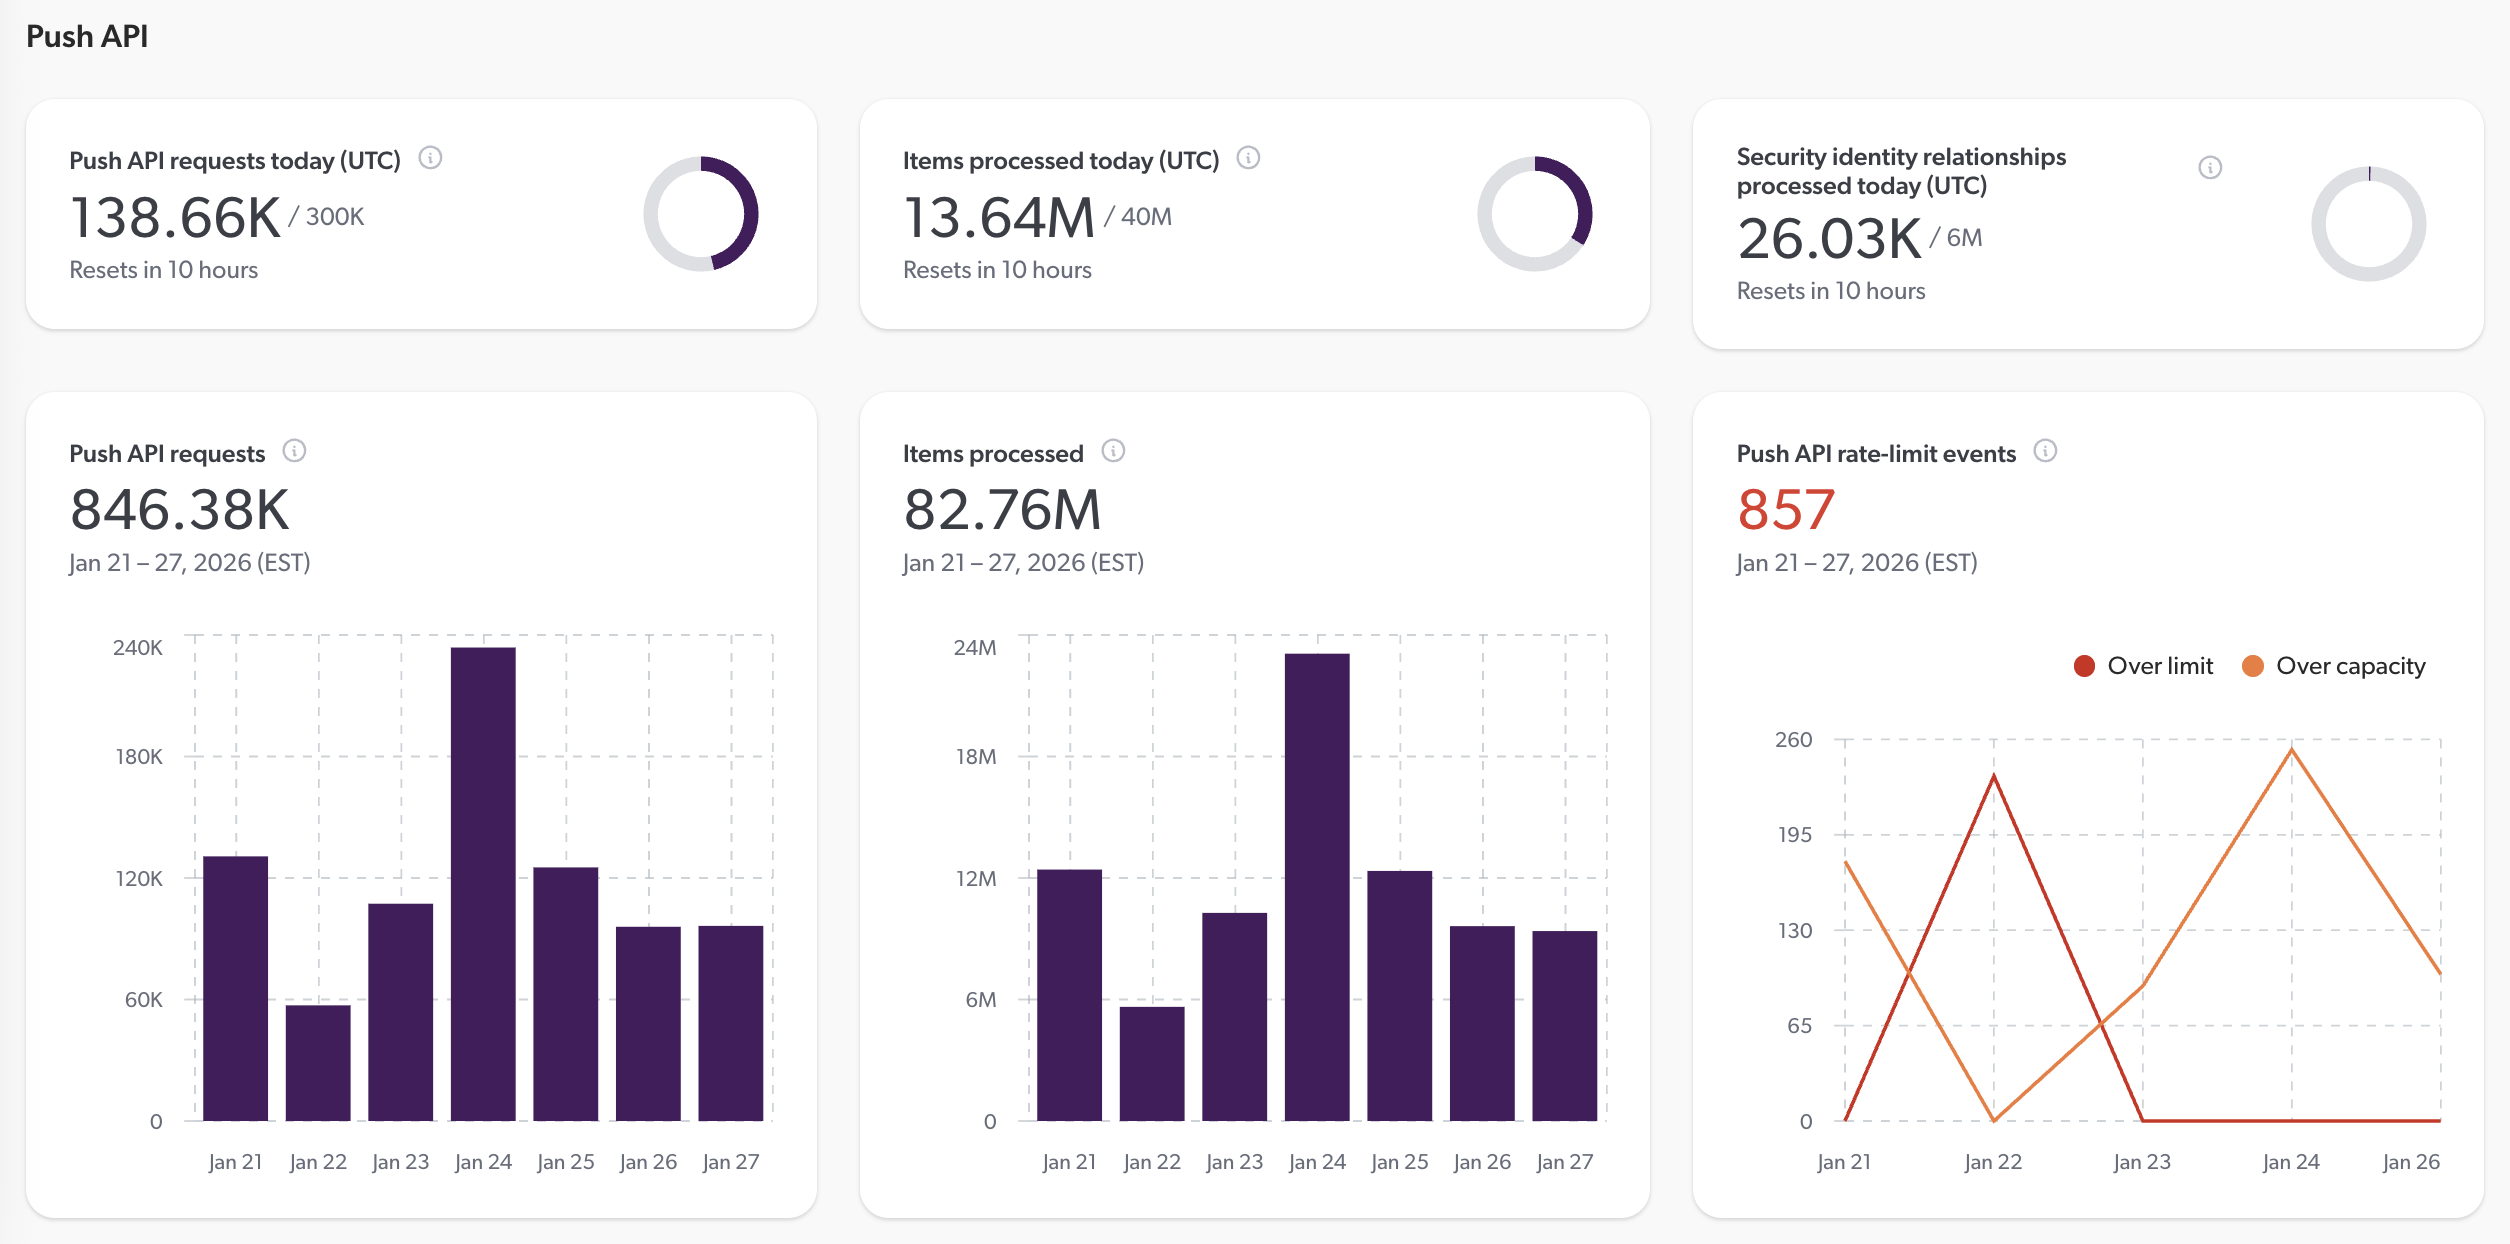
### About rate-limit events
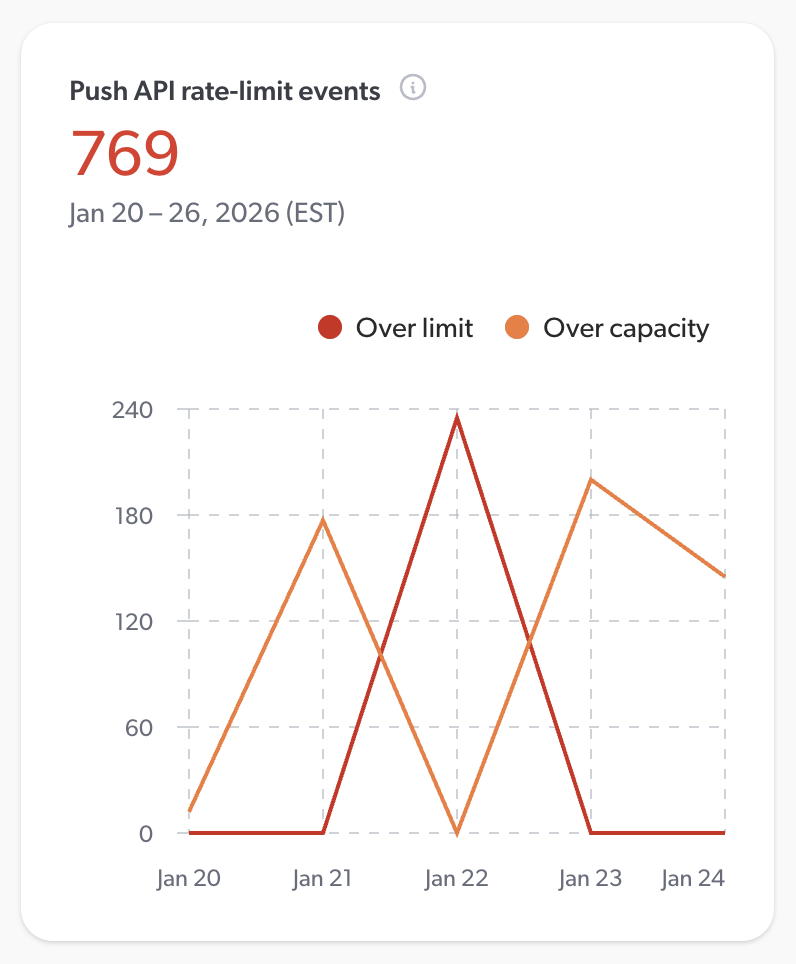
Rate-limit events occur when your organization exceeds the allowed number of requests to a Coveo API within a specified time frame.
These events can impact the performance of your content [indexing](https://docs.coveo.com/en/204/) processes, leading to delays in indexing new or updated content.
The rate-limit events card displays two types of events:
* Over-limit events: These events occur when your organization has exceeded the maximum number of allowed requests to a Coveo API for the day (UTC).
Check the `Retry-After` header in the API response to determine when you can resume making requests.
A high number of over limit events indicates that your sources are frequently being throttled, which may lead to indexing delays and degrade content freshness.
If you think your organization requires a higher rate limit, contact your Coveo representative or [Coveo Support](https://connect.coveo.com/s/case/Case/Default) to discuss your options.
* Over-capacity events: These events occur when your organization has reached the maximum capacity for concurrent requests to a Coveo API.
Your organization can still make requests, but they may be delayed or declined until capacity becomes available.
See [About Coveo’s indexing capacity management](https://docs.coveo.com/en/n91c0225/) for details.
### Optimize your content indexing
If you're satisfied with your [indexing](https://docs.coveo.com/en/204/) performance, no action is needed.
However, if you notice frequent rate-limit events or {indexing pipeline} errors, or if you often approach your [license](https://docs.coveo.com/en/2864/) limits, consider the following optimization tips.
**When approaching license limits, or when dealing with rate-limit events**
Details
* Review and implement the [leading practices for managing your sources](https://docs.coveo.com/en/3390#leading-practices-when-working-with-sources).
* Schedule source updates following the [leading practices](https://docs.coveo.com/en/1933#leading-practices).
* Read about [crawling speed](https://docs.coveo.com/en/2078/).
* If your sources are throttled due to rate-limit events, check the `Retry-After` header in the API response to determine how long to wait before retrying your requests.
* Read about [indexing capacity management](https://docs.coveo.com/en/n91c0225/), especially the [section on implementing a retry mechanism](https://docs.coveo.com/en/n91c0225#how-can-i-automatically-handle-the-situation).
* With the Push API, consider batching your [items](https://docs.coveo.com/en/90/) or [security identities](https://docs.coveo.com/en/55/).
* When [pushing SAP catalog data to Coveo](https://docs.coveo.com/en/ladf2011/), consider [adjusting the concurrency and batch size parameters](https://docs.coveo.com/en/p41b1355/).
* With the Stream API, increase batch size if your source is throttled due to a high number of requests.
If your source is rather throttled due to a high number of items processed, decrease the frequency of updates.
Details
* Select an issue and open it in the Log Browser to investigate the root cause.
Expand the issue for details.
The source or item URI may help you narrow down your investigation.
* If the error comes from an indexing pipeline extension, [check the usage statistics](https://docs.coveo.com/en/1645#about-extension-usage-statistics) on the [**Extensions**](https://platform.cloud.coveo.com/admin/#/orgid/content/extensions/) ([platform-ca](https://platform-ca.cloud.coveo.com/admin/#/orgid/content/extensions/) | [platform-eu](https://platform-eu.cloud.coveo.com/admin/#/orgid/content/extensions/) | [platform-au](https://platform-au.cloud.coveo.com/admin/#/orgid/content/extensions/)) page to identify problematic extensions and [review the indexing logs](https://docs.coveo.com/en/1645#inspect-impacted-item-logs).
Details
Review and implement the [leading practices for managing your sources](https://docs.coveo.com/en/3390#leading-practices-when-working-with-sources).
Details
* Consider a [multi-region deployment](https://docs.coveo.com/en/2976#multi-region-deployments) to reduce latency for users located far from your organization's primary region.
* Check the per-pipeline average response times on the [**Query Pipelines**](https://platform.cloud.coveo.com/admin/#/orgid/search/pipelines/) ([platform-ca](https://platform-ca.cloud.coveo.com/admin/#/orgid/search/pipelines/) | [platform-eu](https://platform-eu.cloud.coveo.com/admin/#/orgid/search/pipelines/) | [platform-au](https://platform-au.cloud.coveo.com/admin/#/orgid/search/pipelines/)) page to identify any pipelines that may require optimization.
* Keep your query pipelines as simple as possible.
The more rules you configure in the query pipeline, the more time it takes to process.
* Follow the [thesaurus rules leading practices](https://docs.coveo.com/en/3405#leading-practices).
* Follow the [ranking expression rules leading practices](https://docs.coveo.com/en/3375#leading-practices).
* Follow the [stop word rules leading practices](https://docs.coveo.com/en/3406#leading-practices).
* If your search interface allows sorting results by a [custom field](https://docs.coveo.com/en/1833#field-origin), make sure to enable the [Sortable](https://docs.coveo.com/en/1833#sortable) and [Use cache for sort](https://docs.coveo.com/en/1833#use-cache-for-sort) options for that field.
Keeping the field in memory improves response time.
* Disable the [Facet, Multi-value facet, Sortable, and Free text search options](https://docs.coveo.com/en/1833#field-options) for fields that don't require them.
* Keep the number of displayed values low in [string facets](https://docs.coveo.com/en/1833#field-type) to reduce facet loading time.
* If most of the indexed items have a different value for a certain string field, disable the [Facet option](https://docs.coveo.com/en/1833#facet-and-multi-value-facet) for this field. Loading many values is resource-demanding, and therefore increases response time. However, if you must have this facet in your search interface, enable the [Use cache for nested queries option](https://docs.coveo.com/en/1833#use-cache-for-nested-queries).
* If your search interface has a range facet, make sure to enable the [Use cache for numeric queries option](https://docs.coveo.com/en/1833#use-cache-for-numeric-queries) for this facet's field.
* Keep the number of search results displayed per page low.
* If [folding results](https://docs.coveo.com/en/1884/), keep the number of results folded inside each top result low.